Powder Bed Fusion Metallurgy: Microstructure of Laser-PBF Ti-6Al-4V and 316L
Laser powder bed fusion (L-PBF) — commercially synonymous with selective laser melting (SLM) — produces components with microstructures unlike those from any conventional manufacturing route. The extreme thermal cycles imposed on each layer (cooling rates of 105 to 107 K/s, thermal gradients exceeding 106 K/m) generate columnar prior-beta grains, martensitic metastable phases, dislocation cell substructures, and crystallographic textures that fundamentally determine mechanical performance. This article provides a graduate-level treatment of L-PBF microstructure formation mechanisms for two commercially dominant alloys — Ti-6Al-4V and 316L stainless steel — covering solidification physics, solid-state transformations, defect metallurgy, and the effects of post-build thermal treatment.
Key Takeaways
- L-PBF imposes cooling rates of 105–107 K/s and thermal gradients above 106 K/m — far beyond conventional casting or welding.
- Epitaxial grain growth driven by directional heat extraction produces strong <001>//Z columnar texture in 316L and reconstructed columnar prior-beta grains in Ti-6Al-4V.
- As-built Ti-6Al-4V contains acicular alpha-prime (alpha’) martensite: hard (~420 HV) but brittle; decomposed to alpha + beta by post-build annealing at 700–800°C.
- L-PBF 316L develops a unique cellular dislocation substructure (cell size ~0.5–1 μm) that raises yield strength to ~550 MPa vs ~220 MPa for wrought-annealed material.
- As-built residual stresses approach yield strength; stress relief before part removal from the build plate is mandatory to prevent distortion and delamination.
- HIP (hot isostatic pressing) closes internal pores and, for Ti-6Al-4V, decomposes martensite, restoring fatigue performance to near-wrought levels.
Laser Powder Bed Fusion: Process Physics and Thermal Regime
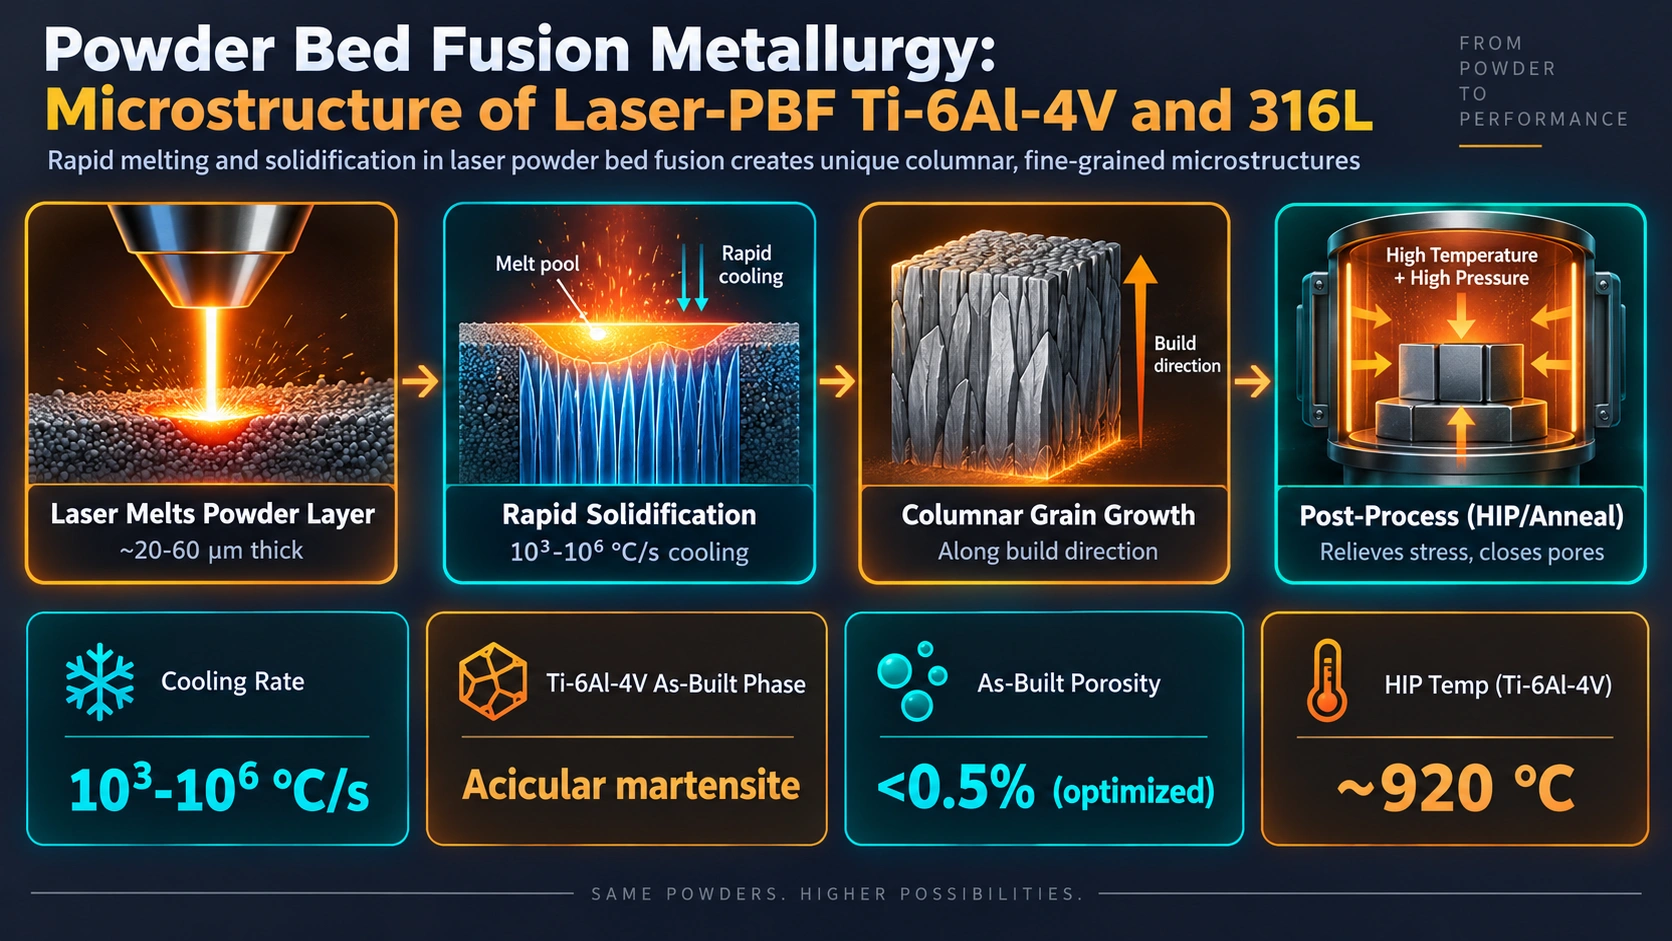
In L-PBF, a focused laser beam (typically a single-mode fibre laser, wavelength 1064 nm, spot diameter 50–150 μm, power 100–400 W) selectively melts each layer of metallic powder spread to a thickness of 20–60 μm. The laser traverses the powder bed at scan speeds of 500–2000 mm/s, creating and extinguishing a melt pool within milliseconds. The consolidated layer then serves as a substrate for the next powder layer, and the process repeats for hundreds to thousands of layers to build the final part.
The energy density input is characterised by the volumetric energy density:
Eₛ = P / (v × h × t)

where:
  P = laser power (W)
  v = scan speed (mm/s)
  h = hatch spacing (mm)
  t = layer thickness (mm)
  Eₛ = volumetric energy density (J/mm³)

Typical optimised ranges:
  Ti-6Al-4V : Eₛ = 50–80 J/mm³
  316L       : Eₛ = 60–100 J/mm³
Melt Pool Thermal Conditions
The thermal conditions within and immediately surrounding the melt pool are extreme by conventional metallurgical standards. Peak temperatures exceed the liquidus by several hundred degrees Celsius, with steep spatial gradients that drive rapid solidification on laser passage. Key thermal parameters, and their typical values for L-PBF, are:
| Thermal Parameter | Symbol | Typical L-PBF Value | Conventional Casting | Significance |
|---|---|---|---|---|
| Thermal gradient at solidification front | G | 106–107 K/m | 103–104 K/m | Drives columnar grain growth; high G suppresses equiaxed nucleation |
| Solidification velocity | R | 0.1–1 m/s | 10-4–10-2 m/s | Sets dendrite/cell arm spacing; high R refines substructure |
| Cooling rate | G × R | 105–107 K/s | 1–100 K/s | Determines phase transformation products; suppresses diffusional phases |
| G/R ratio | G/R | 106–107 K·s/m² | 105–107 K·s/m² | Controls columnar vs. equiaxed solidification morphology |
| Melt pool peak temperature | Tmax | Tliq + 200–600 K | Tliq + 50–200 K | Determines evaporation and keyholing tendency |
Conduction Mode vs. Keyhole Mode Melting
Melt pool geometry shifts between two regimes depending on energy density. In conduction mode, the beam absorptivity is approximately constant (~35% for Ti at 1064 nm) and the melt pool is roughly semi-ellipsoidal with depth-to-width ratio below 0.5. In keyhole mode, the laser intensity exceeds a threshold (~106–107 W/cm2) and a vapour cavity (keyhole) forms in the melt pool through recoil pressure from metal evaporation, dramatically increasing effective absorptivity to 80–90% and creating a narrow, deep melt pool (depth-to-width ratio > 1). Keyhole collapse produces spherical pores (keyhole porosity) typically 20–100 μm in diameter, concentrated near the bottom of melt pools. Process optimisation targets conduction mode or a borderline conduction-transition regime to maximise density while avoiding keyhole pores.
Solidification and Grain Structure in L-PBF
Epitaxial Grain Growth and Columnar Texture
When the laser scans a new powder layer, the melt pool re-melts the upper portion of the previously consolidated layer. This partial re-melting exposes existing grains at the melt pool boundary, which act as seeds for epitaxial grain growth into the liquid. Because no nucleation energy barrier must be overcome at these seed sites, and because the thermal gradient G is oriented predominantly in the build direction (Z), grains grow epitaxially upward — through multiple powder layers — in the direction of maximum heat extraction.
In face-centred cubic (FCC) metals such as 316L stainless steel, the preferred growth direction is <001> (along the cube edge). Grains whose <001> axis is most closely aligned with the build direction Z grow fastest and suppress misaligned neighbours by competitive growth. The result, after many layers, is a strong {001} fibre texture with <001> parallel to Z. EBSD pole figures of as-built 316L consistently show a {001}//Z maximum intensity several times the random level (typically 5–15 × random), with the in-plane (X-Y) texture pattern depending on the scan strategy.
In body-centred cubic (BCC) beta-titanium (parent phase of Ti-6Al-4V above ~1000°C), the easy growth direction is also <001>. Columnar prior-beta grains with <001>//Z therefore develop during solidification, spanning multiple powder layers (typical prior-beta grain width 100–500 μm, length up to several millimetres in extreme cases). Upon cooling through the beta transus (~995°C for Ti-6Al-4V), solid-state transformation to alpha (or alpha’) proceeds within these columnar prior-beta grains, but the grain boundary character of the prior-beta structure is preserved in the transformation product.
Columnar-to-Equiaxed Transition (CET)
The CET — the switch from columnar to equiaxed solidification — occurs when constitutional supercooling ahead of the advancing columnar front becomes sufficient to nucleate new grains before the columnar dendrites can reach them. The Hunt criterion for CET provides a semi-quantitative framework:
CET condition (Hunt, 1984):

G < 0.617 × N₀^(1/3) × [1 − (ΔT_N / ΔT_C)³] × ΔT_C

where:
  N₀ = density of active nucleants (m³)
  ΔT_N = nucleation undercooling
  ΔT_C = constitutional undercooling = m × C₀ × (1 − 1/k)

Engineering levers to promote CET in L-PBF:
  1. Reduce G (lower laser power, increase v)
  2. Increase R (increase scan speed)
  3. Add inoculants (e.g., TiB₂ in Ti alloys; ZrO₂ in Al alloys)
  4. Alloy modification (larger freezing range → more constitutional supercooling)
Achieving equiaxed L-PBF microstructures is commercially significant for isotropy — columnar grains produce anisotropic yield strength and fatigue life (typically 10–20% difference between Z and XY orientations). Efforts to engineer CET in Ti-6Al-4V have used micro-additions of LaB6 and TiB2, achieving grain sizes below 100 μm with near-isotropic tensile properties.
Microstructure of L-PBF Ti-6Al-4V
Phase Transformation Sequence
Ti-6Al-4V is an alpha + beta titanium alloy with a beta transus temperature of approximately 995°C (dependent on exact composition, particularly oxygen content). During L-PBF, the sequence of transformations is:
Solidification (above ~1650°C):
  Liquid → beta (BCC, columnar grains with <001>//Z)

Rapid cooling through beta transus (at ~10⁶K/s):
  beta → alpha' (HCP, martensitic, acicular)
  (Critical quench rate for martensite: >~410 K/s → easily exceeded in L-PBF)

In-situ tempering during subsequent layer deposition:
  alpha' (partially) → alpha + beta (if T > 400°C in underlying layers)

Net as-built structure:
  Columnar prior-beta grains + fine acicular alpha' martensite within
Alpha-Prime Martensite Morphology and Properties
The alpha-prime phase in L-PBF Ti-6Al-4V is structurally identical to equilibrium alpha (both HCP, same Burgers orientation relationship with beta: {0001}alpha’ // {110}beta, <11-20>alpha’ // <111>beta) but is supersaturated in vanadium (a beta stabiliser) and has a significantly finer scale. Lath widths are typically 0.5–2 μm with lengths 5–20 μm, compared to lath widths of 2–10 μm in slowly cooled Ti-6Al-4V. The high density of alpha’–alpha’ and alpha’–prior-beta interfaces provides a Hall-Petch-type strengthening contribution.
| Condition | Microstructure | UTS (MPa) | Yield Strength (MPa) | Elongation (%) | Hardness (HV) |
|---|---|---|---|---|---|
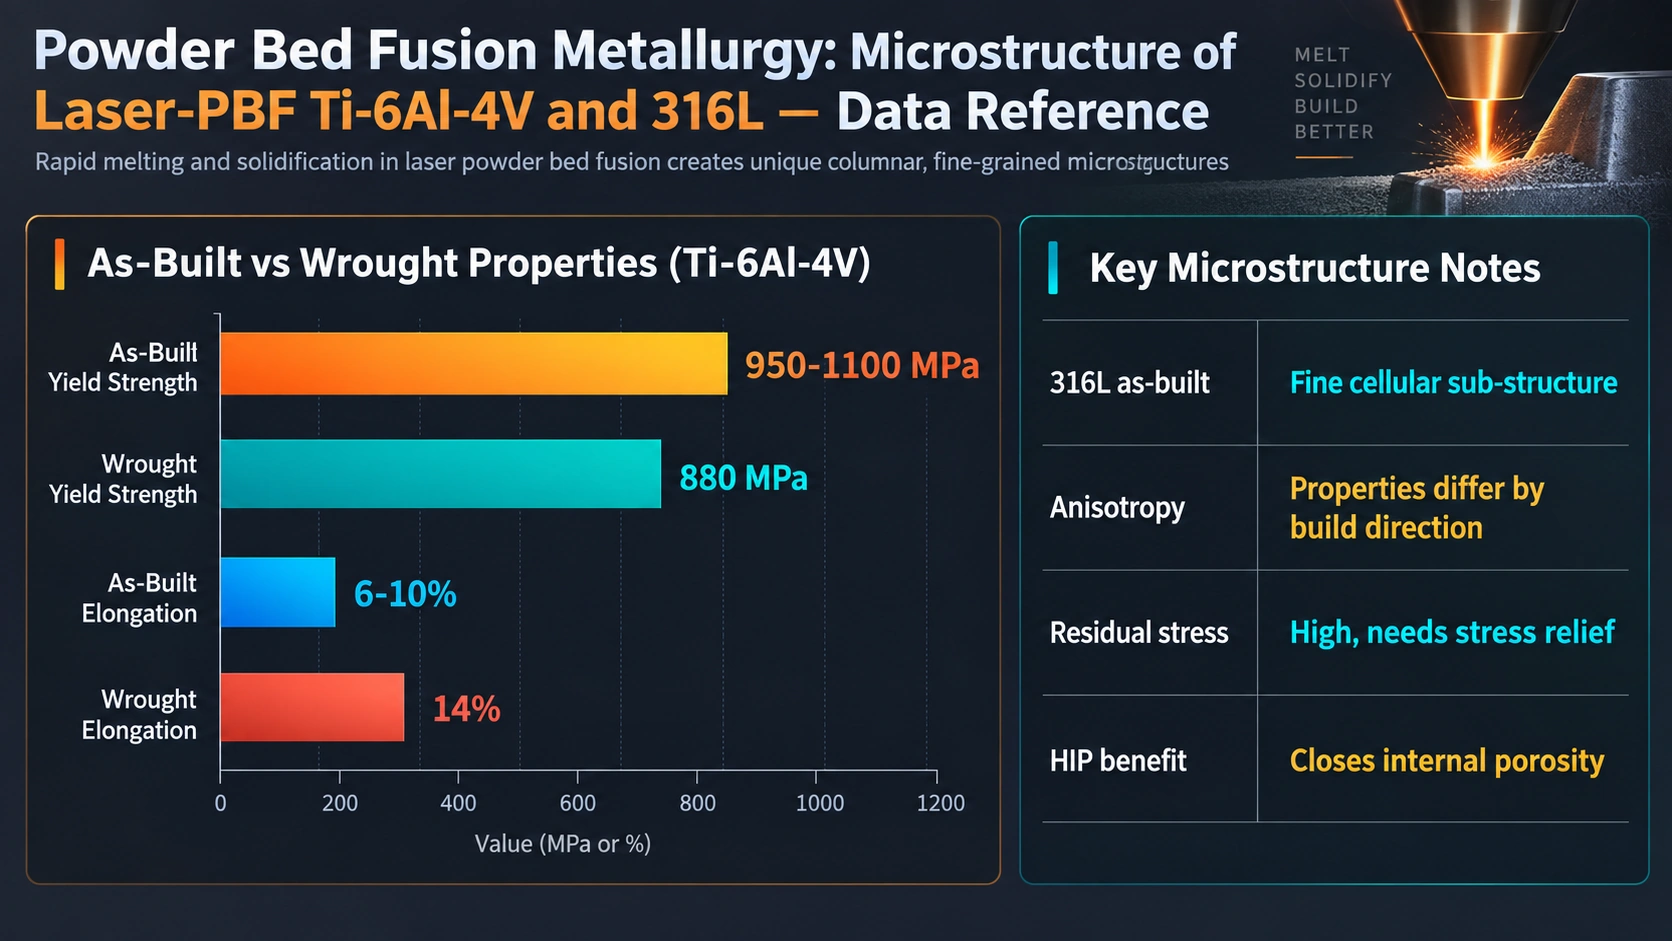
| As-built L-PBF | Columnar prior-beta + acicular alpha’ | 1150–1300 | 1000–1150 | 4–8 | 380–440 |
| Stress-relieved (600–650°C / 4 h, vacuum) | Columnar prior-beta + partially decomposed alpha’ | 1050–1200 | 950–1050 | 8–12 | 340–380 |
| Annealed (800°C / 2 h, FC) | Columnar prior-beta + lamellar alpha + beta | 950–1050 | 880–980 | 10–15 | 300–340 |
| HIP (920°C / 100 MPa / 2 h) | Equiaxed/lamellar alpha + beta, pores closed | 900–1000 | 830–950 | 14–18 | 290–320 |
| Wrought + annealed (reference) | Bi-modal or lamellar alpha + beta | 930–1000 | 860–950 | 14–20 | 300–340 |
Crystallographic Variant Selection in Solid-State Transformation
The beta → alpha’ transformation follows the Burgers orientation relationship (BOR), generating up to 12 crystallographically distinct alpha’ orientation variants per prior-beta grain. In slowly cooled Ti-6Al-4V, all 12 variants typically appear in statistical proportion. In L-PBF, the combination of strong prior-beta texture ({001}//Z) and non-random thermal stress state during cooling causes preferential variant selection — certain variants whose habit plane is most favourably oriented relative to the thermal stress are more densely nucleated. This variant selection is detectable by EBSD and affects the effective slip length, work hardening rate, and fatigue crack path.
Microstructure of L-PBF 316L Stainless Steel
Solidification and Cellular Substructure
316L (Fe-17Cr-12Ni-2.5Mo, low carbon) solidifies as primary delta-ferrite (BCC) under near-equilibrium conditions, but the extremely high cooling rates in L-PBF suppress delta-ferrite formation and direct solidification as austenite (FCC) occurs instead. The solidification substructure is cellular rather than dendritic at typical L-PBF cooling rates (the dendrite arm spacing in cellular-to-dendritic transition occurs at ~ΔT/R < threshold).
Cell diameters are 0.4–1 μm, one to two orders of magnitude finer than dendrite arm spacings in conventionally cast 316L (~50–200 μm). Cell walls are enriched in Cr and Mo (local segregation detected by TEM-EDS: ~1–2 wt% enrichment) and decorated with dislocations, forming a stable cellular dislocation network.
Cellular arm spacing (λ) vs. cooling rate (Cr):

λ ≈ A × Cr^(-n)

For 316L:  A ≈ 50, n ≈ 0.33 (empirical constants)
At Cr = 10⁶ K/s:  λ ≈ 50 × (10⁶)^(-0.33) ≈ 0.5 μm  ✓
At Cr = 10² K/s:  λ ≈ 50 × (100)^(-0.33)  ≈ 11 μm  (conventional casting)

The approximately 20x finer cell size in L-PBF vs. casting reflects
the approximately 10,000x higher cooling rate ratio.
Dislocation Cell Substructure and Strength Enhancement
The defining microstructural feature of L-PBF 316L — distinguishing it from all conventionally processed equivalents — is the hierarchical microstructure: austenite grains (columnar, 50–200 μm wide) contain cellular solidification substructure (0.5–1 μm), and the cell walls contain a high-density dislocation network (dislocation density ~1014–1015 m-2 in cell walls vs. ~1012–1013 m-2 in cell interiors).
The yield strength of as-built L-PBF 316L (~500–600 MPa) is two to three times that of conventionally annealed 316L (~180–230 MPa). This dramatic increase results from three superimposed strengthening mechanisms:
Strengthening contributions (approximate, L-PBF 316L as-built):

σ_y = σ_0 + σ_HP + σ_disloc + σ_solute

σ_0        (friction stress)    ≈  70 MPa
σ_HP        (Hall-Petch, grain)  ≈  90 MPa  [d ≈ 50–100 μm]
σ_disloc    (Taylor hardening)   ≈ 200 MPa  [ρ ≈ 10^14 m², M=3.06, G=76 GPa, b=0.254 nm]
σ_solute    (Cr, Mo segregation) ≈ 100 MPa  [sub-grain solute patterning]

Predicted total:  ≈ 460 MPa  [experimental: 500–600 MPa — consistent]
Critically, this high dislocation density and cell structure is thermally stable up to approximately 600–700°C, because solute pinning at cell walls (the Cr/Mo enrichment) retards dislocation annihilation and recovery. Solution annealing at 1050–1100°C for 30 minutes dissolves the substructure completely, reducing strength to conventional annealed levels but restoring maximum ductility and corrosion resistance.
Texture, Anisotropy, and Scan Strategy Effects in 316L
The strong {001}//Z texture in as-built 316L produces measurable elastic and plastic anisotropy. The {001} direction is the elastically soft direction in austenite (E{001} ≈ 125 GPa vs. E{111} ≈ 211 GPa). Consequently, Z-direction tensile specimens of textured L-PBF 316L exhibit lower Young’s modulus (~170–180 GPa measured) than XY-direction specimens (~190–200 GPa). Yield strength is typically 5–15% lower in the Z direction relative to XY, partly due to texture and partly due to the orientation of LoF pores and partially bonded layer interfaces.
Scan strategy controls texture development:
- Unidirectional scanning: strongest {001}//Z texture with additional in-plane anisotropy between parallel and transverse to the scan direction.
- Bidirectional (meander) scanning: slightly reduced {001} intensity; in-plane anisotropy partially averaged.
- 67-degree rotation per layer: most widely used strategy; distributes thermal gradients to reduce both texture intensity and residual stress magnitude; produces near-isotropic in-plane properties.
- Island/chess-board scanning: further reduces texture intensity and residual stress at the cost of potential inter-island bond defects at high scan speed.
Residual Stress in L-PBF Components
Residual stress generation in L-PBF follows the temperature gradient mechanism (TGM): the laser-heated top layer expands but is constrained by the cooler underlying material, generating compressive plastic strain in the top layer. On subsequent cooling, this compressively strained layer contracts but cannot return to its original dimensions, leaving tensile residual stress in the near-surface region and compressive residual stress in the interior. The stress profile is complex in three dimensions, modulated by part geometry, scan strategy, and substrate restraint.
Temperature Gradient Mechanism (simplified 1D):

On heating:  ε_plastic (compression) = (α × ΔT) − σ_y / E
On cooling:  σ_residual (tension)   ≈ E × ε_plastic

For Ti-6Al-4V at ΔT = 800 K (room to ~800°C):
  α = 8.6 × 10&sup6; /K,  E = 114 GPa,  σ_y = 1000 MPa
  σ_residual (upper bound) ≈ σ_y ≈ 900–1000 MPa

Measured surface residual stresses (XRD, sin²-ψ method):
  316L as-built: +400 to +700 MPa (tensile)
  Ti-6Al-4V as-built: +500 to +800 MPa (tensile)
Post-Build Heat Treatment Strategies
Stress Relief
The primary goal is reduction of residual stresses to prevent distortion on part removal. For Ti-6Al-4V in vacuum or inert gas, 600°C / 4 h reduces surface residual stresses by 70–80% without significantly altering phase constitution (alpha’ partially decomposes). For 316L, 600–650°C / 1–2 h reduces stresses similarly; the cellular dislocation substructure and elevated strength are largely preserved at these temperatures, making stress-relieved L-PBF 316L an attractive engineering material combining high strength with manageable distortion.
Annealing and Solution Annealing
Full annealing of Ti-6Al-4V at 700–850°C / 1–4 h (below beta transus) decomposes alpha’ completely to a fine lamellar alpha + beta aggregate. This improves ductility and fracture toughness at the cost of some strength reduction. The columnar prior-beta structure is retained because the annealing temperature is below the beta transus, but the transformation product morphology changes from acicular martensite to lamellar alpha plates.
Solution annealing of 316L at 1050–1100°C / 30–60 min followed by water quench dissolves the cellular dislocation substructure entirely, eliminating the strength premium but producing maximum corrosion resistance (by homogenising Cr/Mo segregation) and ductility. This treatment is appropriate where fatigue resistance or corrosion performance (pitting resistance) is prioritised over strength.
Hot Isostatic Pressing (HIP)
HIP simultaneously closes porosity and modifies microstructure. For Ti-6Al-4V, standard L-PBF HIP conditions (900–950°C / 100–200 MPa / 2–4 h) lie within the alpha + beta phase field, producing a lamellar or equiaxed alpha + beta microstructure with pore closure reducing porosity from typically 0.05–0.5% to below 0.01%. Fatigue strength at 107 cycles increases from ~400–500 MPa (as-built) to ~600–650 MPa (HIP) due to elimination of pore-initiated crack sites. For 316L, HIP at 1100–1150°C / 150 MPa / 3 h closes pores and additionally solution-anneals the microstructure, removing the dislocation substructure. The fatigue improvement from porosity elimination outweighs the strength reduction in most applications.
Comparison of L-PBF Microstructures with Conventional Processing
| Feature | L-PBF (as-built) | Conventionally Cast | Wrought + Annealed |
|---|---|---|---|
| Grain morphology | Columnar; epitaxial; build-direction preferred | Columnar (outer) + equiaxed (core); coarse | Equiaxed, recrystallised; fine to medium |
| Grain size | 50–500 μm width; length > 1 mm | 500 μm – 10 mm | 10–100 μm |
| Crystallographic texture | Strong fibre texture ({001}//Z for FCC/BCC) | Weak solidification texture; often random after HT | Deformation texture ({{110}}<112> etc.); depends on reduction |
| Phases (316L) | Single-phase austenite + dislocation cell structure; no delta-ferrite | Austenite + skeletal delta-ferrite (3–8 FN); no cells | Single-phase austenite; low dislocation density |
| Phases (Ti-6Al-4V) | Columnar prior-beta + acicular alpha’ martensite | Equiaxed beta + Widmanstätten alpha colonies; coarse | Bi-modal: primary alpha (globular) + lamellar alpha + beta |
| Substructure | Cellular dislocation network (0.5–1 μm); present in 316L | None (low dislocation density after solidification) | Low to moderate dislocation density; sub-grain structure in work-hardened |
| Porosity | 0.05–0.5% (LoF + keyhole); eliminated by HIP | 0.1–2% (shrinkage + gas); eliminated by HIP | Essentially zero |
| Residual stress | High tensile surface (~400–800 MPa) | Moderate (depends on geometry and cooling); often compressive in-service | Low (annealed); moderate compressive from shot-peening |
Industrial Applications and Standards
Aerospace and Medical Applications
L-PBF Ti-6Al-4V is in serial production for aerospace structural brackets, fuel nozzle tips, patient-matched orthopaedic implants (hip and knee components), and dental prosthetics. Regulatory frameworks governing these applications include ASTM F3001 (Ti-6Al-4V ELI for AM), ASTM F3184 (316L for AM), AMS 4999 (Ti-6Al-4V aerospace), and ISO 5832-3 (Ti-6Al-4V for surgical implants). All aerospace fatigue-critical applications mandate HIP per applicable process specification. The FAA Advisory Circular AC 21-45 provides guidance on qualification of AM parts for aviation.
Industrial and Oil and Gas
L-PBF 316L is used for complex manifolds, impellers, and heat exchanger cores in oil and gas and chemical process industries. NORSOK M-630 and NACE MR0175/ISO 15156 apply where sour service (H2S exposure) is relevant; the elevated yield strength of as-built L-PBF 316L must be assessed for hydrogen embrittlement susceptibility. Post-build solution annealing may be required to meet hardness limits (<22 HRC) in sour service per NACE MR0175.
Key Quality Assurance Tests for L-PBF Components
Standard QA for L-PBF components includes: density measurement by Archimedes method (target > 99.5%); X-ray CT for porosity mapping and geometric verification; tensile testing per ASTM E8 (typically from representative witness coupons built alongside the component); hardness mapping (Vickers or Rockwell) as a microstructure surrogate; EBSD for texture verification in critical applications; and residual stress measurement by XRD or neutron diffraction in thick cross-section components. For implants, additional ASTM F136 (Ti-6Al-4V ELI for medical) chemical and metallurgical verification is required.
Related Metallurgical Topics
A thorough understanding of L-PBF microstructure requires familiarity with foundational topics covered elsewhere on MetallurgyZone. The formation mechanisms of martensite in steels provide the crystallographic and thermodynamic framework that applies directly to the beta → alpha’ transformation in titanium. The principles of annealing and normalising govern the decomposition of alpha’ during post-build heat treatment. For understanding the electrochemical performance of L-PBF 316L, the fundamentals of corrosion mechanisms including pitting corrosion are directly relevant, as the cellular Cr/Mo segregation pattern influences pitting potential. The grain boundary energy and segregation principles explain why solute pinning at L-PBF dislocation cell walls retards recovery. The heat-affected zone microstructure in welding shares thermal cycle characteristics with the melt pool boundary in L-PBF. For quantitative property predictions, see the hardness testing methods and Charpy impact test articles. The iron-carbon phase diagram provides the thermodynamic context for phase stability. The quenching and tempering article covers tempering kinetics applicable to alpha’ decomposition in Ti-6Al-4V.
Frequently Asked Questions
Why do laser PBF builds develop columnar grains aligned with the build direction?
What is alpha-prime martensite in as-built L-PBF Ti-6Al-4V and why does it form?
What is the columnar-to-equiaxed transition (CET) in PBF, and how can it be engineered?
How does the cellular dislocation substructure in L-PBF 316L stainless steel form and what are its consequences?
What causes anisotropic mechanical properties in L-PBF components?
What is hot isostatic pressing (HIP) and why is it critical for L-PBF aerospace components?
How do melt pool geometry and scan strategy affect microstructure in L-PBF?
What residual stresses develop in L-PBF and what are their metallurgical consequences?
How does the microstructure of L-PBF Ti-6Al-4V compare to wrought and cast Ti-6Al-4V?
What characterisation techniques are most informative for L-PBF microstructure analysis?
Recommended References
Further Reading
