Lever Rule Phase Fraction Calculator for Binary Phase Diagrams
Last updated: · Reading time about 9 minutes
A lever rule calculator converts an alloy’s overall composition and the two tie-line boundary compositions into the fraction of each phase present at equilibrium. It is the arithmetic step behind every phase-fraction question on a binary phase diagram, and this page keeps the tool front and centre while the diagram theory stays in the guide to binary phase diagrams. The same method gives the ferrite, cementite and pearlite fractions on the iron-carbon phase diagram.
Lever Rule Calculator: Phase Fractions from a Tie Line
- The lever rule is a mass balance, so it returns mass (weight) fractions.
- Each phase fraction equals the opposite tie-line segment divided by the whole tie line.
- It applies only inside a two-phase field, at equilibrium, on one composition basis.
- Volume fraction needs phase densities and is not the same as mass fraction.
- Phase fractions and microconstituent fractions, such as pearlite, need separate tie lines.
What Is the Lever Rule?
Lever rule is the mass balance giving phase fractions from tie-line lengths in a two-phase field.
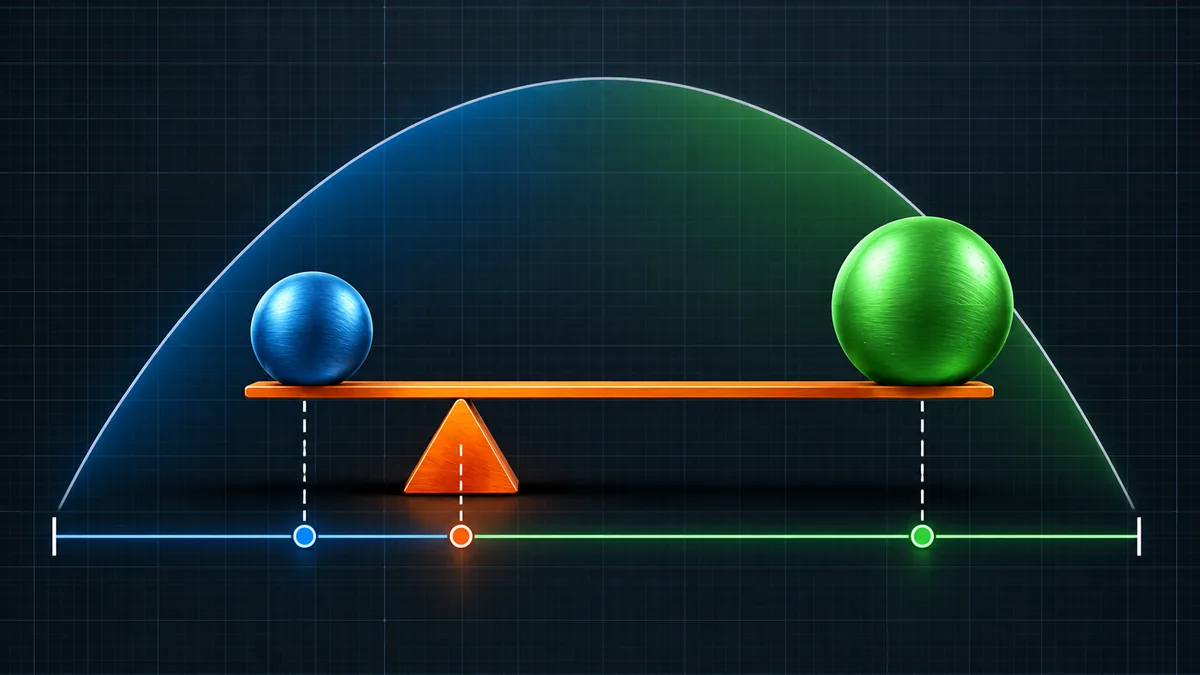
In a two-phase region of a binary diagram, the compositions of the two phases are fixed by the tie line at the chosen temperature. What is not fixed is how much of each phase there is. That depends on where the overall alloy composition sits along the tie line. The name comes from the mechanical analogy: the alloy composition acts as the fulcrum, and each phase fraction is proportional to the arm on the opposite side.
The rule is a property of the diagram geometry, not of any one alloy system. The same arithmetic gives liquid and solid fractions in a solidification range, alpha and beta fractions in a eutectic system and ferrite and cementite fractions in steel. For the reading of the diagrams themselves, including phase fields and invariant reactions, see the binary phase diagrams guide linked above.
How Is the Lever Rule Derived?
Take one unit mass of alloy with solute content C0 split into phase A of composition C(A) and phase B of composition C(B). Two conservation statements fix the two unknown fractions: the fractions add to one, and the solute in the phases adds up to the solute in the alloy.
Because the numerator is the arm on the far side, a composition close to boundary A gives mostly phase A. At C0 equal to C(A) the fraction of A is exactly 1, and at C0 equal to C(B) it is 0. The calculator enforces that C0 lies between the two boundaries, since outside that interval the alloy is a single phase and no lever applies.
How Do You Use the Lever Rule Calculator?
Read the three compositions from the phase diagram at the temperature of interest before opening the tool. The steps are:
- Read the temperature of interest on the phase diagram and draw a horizontal tie line across the two-phase field.
- Enter the alloy composition C0 in weight per cent, and optionally name the two phases.
- Enter the compositions where the tie line meets the left and right phase boundaries.
- Optionally enter both phase densities in g/cm3 to get volume fractions as well.
- Press Calculate, or press Enter in any field, then press Reset to start a new case.
The result panel shows each fraction as a number and as per cent, plus the arithmetic used, so a result can be checked by hand. Other tools in the same family are listed in the Calculators hub, including the Jominy hardenability calculator for quenched steels.
Worked Example: A 0.40 wt% Carbon Steel Below 727 °C
A plain 0.40% carbon steel is cooled slowly to just below the eutectoid temperature. The structure is proeutectoid ferrite plus pearlite, and the same alloy is also, in phase terms, ferrite plus cementite. Two tie lines answer the two questions. The boundary values are ferrite at 0.022% C, the eutectoid composition at 0.77% C (see the page on the eutectoid reaction in steel) and cementite at 6.70% C.
The distinction matters in practice. Counting pearlite on a micrograph gives about half the structure, yet phase-wise the steel is over 94% ferrite. Mechanical properties follow the arrangement of the phases, not only their amounts, which is why the pearlite fraction is used when estimating strength and why hardness checks from the guide to hardness testing methods are compared against microstructure.
How Do You Read a Tie Line Correctly?
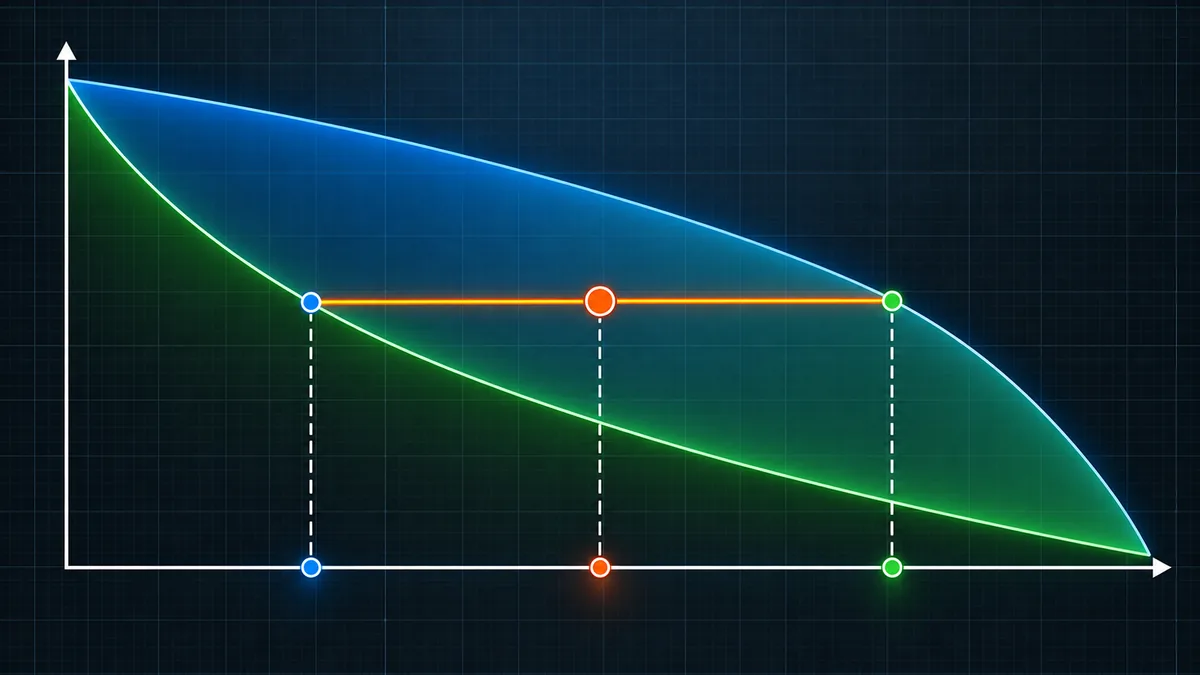
Most wrong answers come from the inputs, not the arithmetic. Follow the same sequence each time:
- Draw a horizontal line at the temperature of interest. Tie lines are isothermal.
- Mark the alloy composition on that line.
- Find where the line meets the nearest phase boundary on each side. Those two compositions are the tie-line ends.
- Confirm that the alloy point lies inside a two-phase field, not at a single-phase or three-phase condition.
- Use boundary values read at that exact temperature. They shift as the temperature changes.
When the tie line ends on an invariant line, such as just below a eutectoid, the boundary compositions are the textbook values for that reaction. Reading a curved boundary off a printed chart is usually the largest source of error, so a one-division misreading on a steep boundary can move a fraction by several per cent.
How Do You Convert Mass Fraction to Volume Fraction?
The lever rule returns mass fractions. Where a property depends on volume, convert with the phase densities ρ(A) and ρ(B):
The light phase occupies far more volume than its mass share suggests. For phases with close densities, such as ferrite and cementite, mass and volume fractions are nearly the same. Enter both densities in the calculator to see the conversion.
When Does the Lever Rule Fail?
Common mistakes
- Using it in a single-phase field. The alloy then has 100% of that phase and no tie line exists.
- Mixing weight and atomic per cent. The diagram axis and all three inputs must use the same basis.
- Treating a three-phase point as two-phase. At an invariant temperature, split the problem just above or just below it.
- Confusing phases with microconstituents. Pearlite is two phases; use the eutectoid tie line for it, as in the worked example.
- Quoting mass fraction as volume fraction. The two differ when densities differ.
Range of validity
Equilibrium needs time. Rapid cooling produces coring and non-equilibrium phases, so a quenched steel contains martensite that appears on no equilibrium diagram. The speed at which real steels depart from equilibrium is shown on a TTT diagram and a CCT diagram, and the effect of fast cooling is covered in the article on martensite in steel. Solute segregation to grain boundaries also makes local composition differ from the average. The tie-line values on the diagram are accurate to the data behind it, so quote results to two or three significant figures at most.
Quick Reference: Common Tie-Line Compositions
| Point | Carbon, wt% | Temperature |
|---|---|---|
| Maximum solubility in ferrite | 0.022 | 727 °C |
| Eutectoid composition (pearlite) | 0.77 | 727 °C |
| Maximum solubility in austenite | 2.14 | 1147 °C |
| Eutectic composition (ledeburite) | 4.30 | 1147 °C |
| Cementite (Fe3C) | 6.70 | All |
| Example | Tie line (wt%) | Phase A | Phase B |
|---|---|---|---|
| Fe-C 0.40% C, microconstituents | 0.022 to 0.77 | 49.5% ferrite | 50.5% pearlite |
| Fe-C 0.40% C, phases | 0.022 to 6.70 | 94.3% ferrite | 5.7% cementite |
| Pb-Sn 40% Sn, just below 183 °C | 19.2 to 97.8 | 73.5% alpha | 26.5% beta |
Key Terms
- Phase
- A physically distinct region of uniform structure and composition, such as ferrite, cementite or liquid.
- Tie line
- An isothermal line across a two-phase field whose ends give the equilibrium phase compositions.
- Lever rule
- The mass balance that gives phase fractions from the lengths of the tie-line arms.
- Microconstituent
- A recognisable feature of the microstructure, such as pearlite, which may itself contain more than one phase.
- Proeutectoid phase
- The phase that forms before the eutectoid reaction on slow cooling, such as ferrite in a hypoeutectoid steel.
- Eutectoid
- The solid-state reaction in which one phase transforms into two others at a fixed temperature and composition.
- Mass fraction
- The mass of one phase divided by the total mass of the alloy.
Frequently Asked Questions
What is the lever rule in a phase diagram?
The lever rule is a mass balance that gives the equilibrium fraction of each phase in a two-phase region. Each phase fraction equals the length of the tie-line arm on the opposite side of the alloy composition divided by the full tie-line length.
Does the lever rule give weight fraction or volume fraction?
It gives mass (weight) fraction when the diagram axis is in weight per cent. Volume fraction needs the phase densities and a separate conversion, which the calculator performs if both densities are entered.
Can I use the lever rule in a single-phase region?
No. In a single-phase field the alloy is 100% of that phase and there is no tie line. The calculator rejects any alloy composition outside the two boundary compositions.
Why do I get different answers for ferrite and pearlite fractions?
Pearlite is a microconstituent made of ferrite and cementite. The tie line from 0.022 to 0.77 wt% C gives proeutectoid ferrite and pearlite. The tie line from 0.022 to 6.70 wt% C gives total ferrite and cementite.
Can the lever rule be used with atomic per cent?
Yes, if all three compositions are in atomic per cent, but the result is then an atomic or mole fraction. Convert to weight per cent first if a mass fraction is required.
Does the lever rule work for fast-cooled or quenched alloys?
Not directly. It describes equilibrium. Rapid cooling gives coring and non-equilibrium phases such as martensite, so the result is only the reference state that a slow-cooled alloy would approach.
How accurate is a lever-rule result?
The arithmetic is exact, but the answer is only as accurate as the boundary compositions read from the diagram. Reading errors on steep or curved boundaries can shift a fraction by a few per cent, so quote two or three significant figures.
Conclusion
The lever rule turns a binary phase diagram into numbers. Read the two tie-line boundaries at the temperature of interest, place the alloy composition between them and divide the opposite arm by the whole tie line to get the mass fraction of each phase. Keep every composition on one basis, stay inside a two-phase field and remember that the answer is an equilibrium value. Distinguish phases from microconstituents, as the 0.40% carbon example showed, and convert to volume fraction when a property depends on volume. Once the equilibrium fractions are known, the next step is to see how cooling rate changes the real structure, which the complete guide to quenching steel explains.
About This Guide
This guide is published by the MetallurgyZone editorial team. The method is the standard equilibrium mass balance, and the calculator has been tested against the worked examples on this page. It is educational material and does not replace the data in a qualified phase diagram reference or a customer specification.
Standards and References
- ASM Handbook, Volume 3: Alloy Phase Diagrams, ASM International (asminternational.org).
- ASM Handbook, Volume 9: Metallography and Microstructures, ASM International.
- ASTM E562, Standard Test Method for Determining Volume Fraction by Systematic Manual Point Count, ASTM International (astm.org).
- ASTM E1245, Standard Practice for Determining the Inclusion or Second-Phase Constituent Content of Metals by Automatic Image Analysis, ASTM International.
- W. D. Callister and D. G. Rethwisch, Materials Science and Engineering: An Introduction, Wiley.
